billboard.js 3.11 release: range text for Arc & more!
v3.11 released 🥳 🎉 today! This release comes with 5 new features, 9 bug fixes and improvements.
For the detailed release info, please checkout the release note:
https://github.com/naver/billboard.js/releases/tag/3.11.0
What’s New?
arc.rangeText
This feature can be useful for Arc (donut, gauge, and pie) types, as it allows you to display the range of values for a particular variable in a more intuitive and easy-to-understand way.
For example, instead of showing a single number representing the value of a variable, you can show a range of values around the shape, such as a donut chart with a range of values displayed around the hole.
Demo: https://naver.github.io/billboard.js/demo/#DonutChartOptions.DonutRangeText
https://naver.github.io/billboard.js/demo/#GaugeChartOptions.GaugeRangeText
To mitigate, specify range values in absolute or percent unit.
arc: {
     rangeText: {
       values: [15, 30, 50, 75, 95],
       unit: "%", (default: 'absolute')
       fixed: false, // only available for gauge chart
       format: function(v) {
         return v === 15 ? "Fifteen" : v;
       },

       position: function(v) {
         // can return one props value also.
         return v === 15 ? {x: 20, y: 10} : null;
       },
       position: {x: 10, y: 15},
       position: {x: 10}
     }
}
Based on the option, range text will be displayed around the Arc shape. Range text will interact based on the toggle of the dataseries.

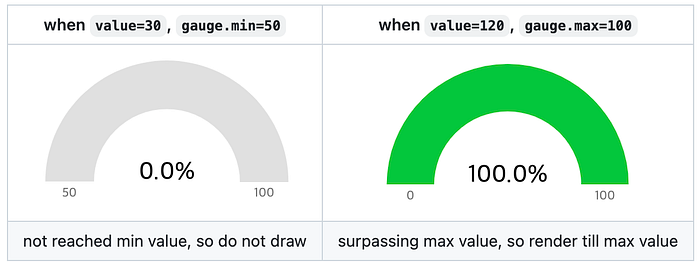
gauge.enforceMinMax
When values are given outside the specified gauge’s minimum and maximum value range, it is displayed in an unusual way.
This can make data visualization difficult because it’s important to represent the data in a clear and accurate manner. However, specifying the minimum and maximum values allows us to display the data within a specific range.
To address this issue, we have the gauge.enforceMinMax feature.
Demo: https://naver.github.io/billboard.js/demo/#GaugeChartOptions.GaugeMinMax
gauge: {
  // enforce min/max value.
  // when given value < min, will render as empty value.
  // when value > max, will render to given max value not surpassing it.
  enforceMinMax: true,

  // when given value is 30, gauge will render as empty value.
  min: 50,

  // when given value is `120`, gauge will render till 100, not surpassing max value.
  max: 100.
}
When the option is enabled, the shape visualization won’t be altered even given data value is not on the range.
gauge.label.ratio
Similar as [donut|pie|polar].label.ratio option, this option will make to update gauge label text’s position.
Demo: https://naver.github.io/billboard.js/demo/#GaugeChartOptions.GaugeLabelRatio
Usage is very straightforward. Specifying ratio=1, will make label text to be positioned centroid of each data area.
gauge: {
   label: {
      // set ratio callback. Should return ratio value
      ratio: function(d, radius, h) {
        ...
        return ratio;
      },
      // or set ratio number
      ratio: 0.5
   }
}
Formatter for legend text
When given long data series name, legend text displayed as is without altering it. But in some occasion, legend can occupy area widely, disrupting whole chart visualization.
Demo: https://naver.github.io/billboard.js/demo/#Legend.LegendFormat
To mitigate this, will provide formatter option to adjust legend text based on the needs.
legend: {
      format: function(id) {
          // set ellipsis string when length is > 5
          // to get full legend value, combine with 'legend.tooltip=true'
          return id.length > 5 ?
              `${id.substr(0, 5)}...` : id;
      },

      // set to add `<title>` element to visualize short-hand system tooltip to see full legend text value
      tooltip: true,
}
If legend text shortened, can’t recognize the meaning of the data by legend. In this case, set legend.tooltip=true as a helper.
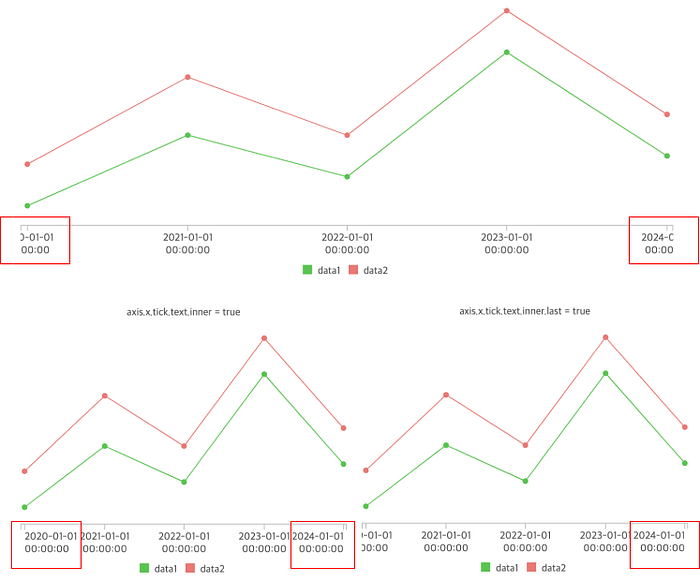
axis.x.tick.text.inner
In a condition where first and last x axis appears at the beginning and the end of the container, part of x axis tick text are hidden.
This is because, tick text position are aligned at the center of the x axis tick.
Demo: https://naver.github.io/billboard.js/demo/#Axis.XAxisTickInner
New axis.x.tick.text.inner option will make to control the visibility of first/last tick text.
axis: {
  x: {
    tick: {
      text: {
         inner: true

         // or specify each position of the first and last tick text
         inner: {
           first: true,
           last: true
         }
      }
    }
  }
}
Closing
Another new year started, and another new released came out.
Thanks for the community as always!