billboard.js 3.1 release: subchart & data loading enhancements!
This release comes with 6 new features added & 10 bug fixes.
For the detailed release info, please checkout the release note:
https://github.com/naver/billboard.js/releases/tag/3.1.0
What’s New?
Contain inline css props
From this release, some of inline css properties are removed to be set.
Why contain?
Mainly because inline css props interfering user’s style definition to be applied. Before the v3.1, to overwrite inline css props, needed to specify !important rule on each of affected props.
This worked fine in some extent, but is a tedious and unnecessary.
To improve this, removed those inlined css props where the default behaves same way. The affected list of properties are:
- opacity: 1
- visibility: “visible”
- display: “block”
If these(with corresponding value) aren’t specified(or defined), will behaves same way as specified value. So, basically removing will not affect the current rendering and will make more flexibility to be controlled by user’s own css rule definition.

subchart.init.range
This new option will make to initialize zoom-in indicated subchart range.
Simply indicate the range, and the initial chart will be rendered as indicated range value.
subchart: {
    enabled: true,
    init: {
        // specify initial range domain selection
        range: [2, 4]
    }
}
This option will make to visualize the area to emphasize specified data.

subchart.showHandle
Subchart’s selection range is controlled by drag interaction. The selected area is shown during the drag interaction, letting user to recognize easily the amount of area.
After selection range is set, the range can be modified dragging left/right corner of the selection square. This isn’t very noticeable before, because the selection range doesn’t give any perception as modifiable range.
To improve this, added option to visualize a “handler”, where user easily notice controllable range.
Demo: https://naver.github.io/billboard.js/demo/#Interaction.SubChart
subchart: {
    show: true,
    showHandle: true
}
After specifying subchart.showHandle, will appear a handle control at each edge of the selection range square box.

Data load append option
Dynamic data loading is one of the most used functionality.
One of the most request from the community was the ability to “append” loaded data to the current.
Before the v3.1, when load API is called,
// Given chart
const chart = bb.generate({
    data: {
      x: "x",
      xFormat: "%Y-%m-%dT%H:%M:%S",
      columns: [
        ["x", "2021-01-03T03:00:00", "2021-01-04T12:00:00", "2021-01-05T21:00:00"],
        ["data1", 36, 30, 24]
      ]
    },
    axis: {
      x: {
        type: "timeseries"
      }
    }
});

// load new data
chart.load({
    columns: [
      ["x", "2021-01-13T08:00:00", "2021-01-15T08:00:00"],
      ["data1", 37, 40]
    ]
1});
The current data was unloaded, and new loaded data was replacing it.

If want append to the current, it needed to load whole data series’ dataset again. This wasn’t very ideal approach way at all.
From this release, introduced newappend option, where just specifying it, will make to append it rather than replacing the current dataset.
// load new data by appending it.
chart.load({
    columns: [
      // when existing chart has `x` value, should provide
      // corresponding 'x' value.
      // with 'append' option, the 'data1' will have `[36,30,24,37, 40]`.
      ["x", "2021-01-13T08:00:00", "2021-01-15T08:00:00"],
      ["data1", 37, 40]
    ],
    append: true
});
data.onshown/onhidden
These new option will give an alternative option to trigger some connected tasks during dataseries’ visibility changes.
Simply, set callback function for each occasion.
data: {
    onshown: function(ids) {
        console.log("data shown:", ids);
    },
    onhidden: function(ids) {
        console.log("data hidden:", ids);
    },
}
Whenever the visualized dataseries’ visibility changes, will trigger the specified callback function.
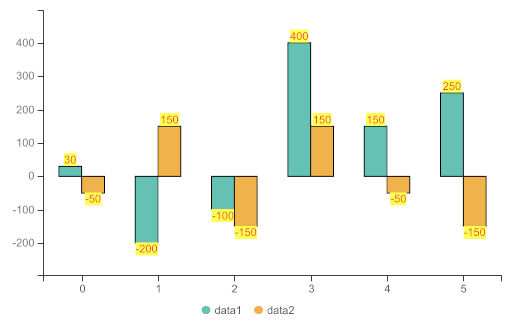
data.labels.backgroundColors
This enhancement will make to render data label text background’s color with very simple effort.
Demo: https://naver.github.io/billboard.js/demo/#Data.DataLabelColors
To make this possible for svg element, normally it needed to add new element for that purpose. But adding new element for this will make to sacrifice performance.
So, we approached this via filter attribute, not adding any new element to fulfill this.
There’re two ways to apply background colors. Apply for entire texts or specify different color for each dataseries.
Note: If specifies color value using rgba, can control the opacity for background color.
data: {
    labels: {
      backgroundColors: "yellow",      // or specify colors for each dataseries.
      backgroundColors: {
          data1: "green",
          data2: "rgba(0, 0, 0, 0.2)"
      }
    }
}
What’s Next?
The planned next release will be September. As always, we will be working to implement and enhance new functionality to bring ease data visualization on web platform.
Stay tuned for the next release!
See ya~ 😃