billboard.js 1.10 release: Bubble dimension, axis culling & more!
This release comes with 4 new features added & 9 bug fixes.
For the detailed release info, please checkout the release note:
https://github.com/naver/billboard.js/releases/tag/1.10.0
What’s New?
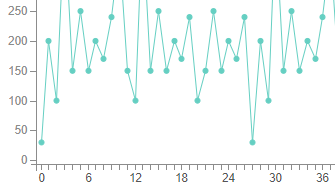
Bubble dimension
The ‘bubble’ visualizes the amount by its dimension. Normally attached with the axes, displaying bigger bubble when it goes from bottom to the top.

It’s okay visualize data based on axes value, but what about if the dimension itself to represent a ‘third’ data?
Here is an example.
- x Axis: represent GDP per capita
- y Axis: represent Life expectancy
- Bubble’s dimension: the total GDP by region.

To accomplish this, a third data is needed to represent its dimension value. And of course, the y Axis value also should be handled along with.
For this, just apply data having y and z(dimension) value. There’s no need to indicate x value additionally, because it will follow the data order sequence.
// for 'bubble' type, data can contain dimension value:
// - an array of [y, z] data following the order
// - or an object with 'y' and 'z' key value
// 'y' is for y axis coordination and 'z' is the bubble radius value
data: {
  columns: [
     ["data1",
         [10, 140],  // or {y:10, z: 140}
         [100, 30],
         200
     ]
  ],
  type: "bubble"
}
The data types, containing dimension value or not, can be combined within data series.
With the new feature, you can visualize bubbles untied from y Axis as the screenshot.
Demo: https://naver.github.io/billboard.js/demo/#Chart.BubbleDimensionChart

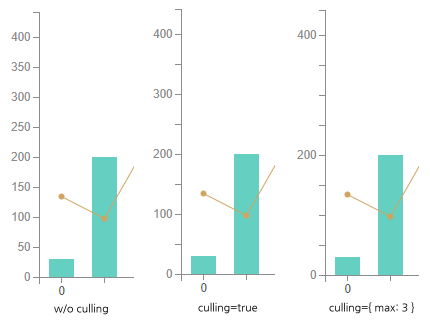
Culling for y/y2 axes
The culling option, lets handle the amount of tick texts to be displayed.
Let’s check the below example. Tick texts are overlapped each other and it is harder to read.

To avoid this, by default culling option is set to true and with this option tick texts are displayed having intervals.
As the enhancement, culling functionality is added for y and y2 axes from this release. The interface is simple and straightforward, same as the x one.
Demo: https://naver.github.io/billboard.js/demo/#Axis.YAxisTickCulling
axis: {
 y: {  // or 'y2'
  tick: {
   culling: false   // or set maximum tick text count to be displayed
   culling: {
      max: 5
   }
  }
 }
}
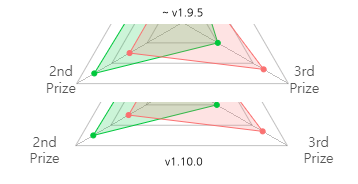
Radar axis text position
Adjustment of radar axis text position was added to this release. When mutilined text value is used, there’s a possibility of text’s position to be close from its axis edges and for some cases overlapping with the shape.
To avoid this, an update was applied calculating text’s position. It’s applied by default without specifying any additional option value.
But, what about if needed to control the position? For this occasion use cases, added new radar.axis.text.position option.
radar: {
axis: {
text: {
// Specify 'x' or 'y' value relative its original position.
position: {
x: 5,
y: -5
}
}
}
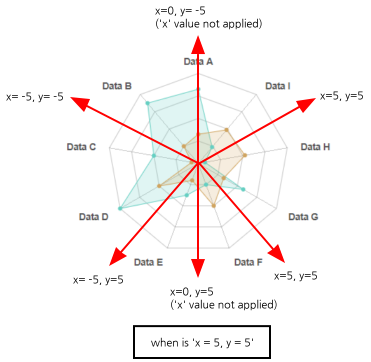
}Before applying this option, take in mind some details. The position value will act differently for each axes(or edges).
For the axes texts positioned left side of the shape, the real x value should be decremental, whereas the right sided should be incremental when positive x value is specified.
And what about for the top positioned text? In this case, x value shouldn’t be applied, only y value is meaningful.
To get rid all the condition to be handled by yourself, this job will be handled automatically for you!
Demo: https://naver.github.io/billboard.js/demo/#RadarChartOptions.RadarLevel
Improvement on callback options
The lifecycle callback options as listed below, there was’t a simple way to access the current instance itself.
Accessing instance can facilitate some tedious jobs, like accessing chart node elements via $ member object without the need to select.
As an enhancement, will pass context argument for all the callback options.
var chart = bb.generate({
    // @param {Chart} ctx - Instance itself
    onrendered: function(ctx) {
        // ctx == chart
        ...
    }
};
New release process adoption
If you followed closely on billboard.js release cycles recently, probably experienced that releases happening more frequently than as usual.
As anticipated from the previous release post, release process automation was applied by the contribution of github/@austince.
Starting from 1.9 release, the intended & updated policies are as follows.
- To be more frequent
For the patch version, will be released as soon as possible. Is mainly to provide fixed version more frequently & let users apply without the need to wait for the next release period. - Shorten release period
Implicitly, we maintained in a 3 months period for each release. But as the cut of some burden on release process, we will try to cut the 3 months release period. - New RC(
@next) channel
Starting from this release, the pre-released version(Release Candidate) will out before the official release.
We’re planning to run in a period of 1 ~ 3 weeks to give some period of tests for users.
What’s Next?
We started to planning work for the 2.0. Is in very early stage, so there’s no significant info to share yet. Our intention is hoping to make out within this year.
Well, as always we’re waiting for the community contributions which will led making improvements helping others!
Stay well until the next release :)